
Introduction
Measure maintenance performance
When critical equipment breaks down, it costs you. Operational delays, unplanned maintenance costs, off-hire periods, and increased pressure on crews and shore-based teams. That is why measuring maintenance performance matters. The right metrics show how frequently equipment fails, how long repairs take, and how breakdowns affect operational readiness. Combined with maintenance histories and cost data, they can also help technical teams identify where operational losses occur.
The basics
What are MTBF, MTTR, and availability?
Mean Time Between Failures (MTBF), Mean Time To Repair (MTTR), and availability are three of the most widely used maintenance KPIs. Each metric provides useful information on its own, but they are most valuable when used together to evaluate asset performance and improve maintenance planning.
Mean Time Between Failures (MTBF)
MTBF measures the average operating time between failures of a repairable asset. It indicates equipment reliability: a higher MTBF generally means that the equipment fails less frequently. However, MTBF is an average time and does not predict exactly when the next failure will occur.
MTBF = Total operating time ÷ Number of failures
A ballast pump operates for 2,400 hours and experiences six failures:
MTBF =
2,400 hours
6 failures
= 400 hours
The calculation is only meaningful when failures are defined and recorded consistently. Comparisons should also involve equivalent assets operating under reasonably similar conditions.
Mean Time To Repair (MTTR)
MTTR measures the average time required to restore equipment after failure. It reflects how efficiently the problem is diagnosed, the repair is completed, the equipment is tested, and it is returned to service. A lower MTTR generally means less downtime.
MTTR = Total repair time ÷ Number of repairs
For example, six repairs on a ballast pump require a combined 30 hours:
MTTR =
30 Hours
6 Repairs
= 5 hours
MTTR is not always defined in the same way. Some include only active diagnosis and repair time, while others include waiting for spare parts, vendor support, testing, and other logistical delays. To compare MTTR across a fleet, define clearly when the measurement starts, when it ends, and which delays it includes.
Availability
MTTR measures the average time required to restore equipment after failure. It reflects how efficiently the problem is diagnosed, the repair is completed, the equipment is tested, and it is returned to service. A lower MTTR generally means less downtime.
Availability = MTBF ÷ (MTBF + MTTR) × 100
This example uses the calculations from the two previous MTBF and MTTR balast pump examples
Availability =
400 Hours
400 Hours + 5 hours
x 100
= 98.8% Availability
A longer MTBF or shorter MTTR improves estimated availability. Measured operational availability may also include planned maintenance, logistical delays, administrative delays, and other sources of downtime, depending on how you define the KPI.
MTBF in practice
Applying MTBF in maritime maintenance
By tracking MTBF, technical teams can identify equipment that reduces operational reliability and investigate recurring failure patterns.
Linking spare parts to components and maintenance activities can also improve planning and reduce delays caused by unavailable inventory.
Read more
Get control with Inventory Management
SERTICA helps you keep track of your inventory, so you always know if the spares are in stock, and helps your procurement department know when to reorder
MTTR in practice
Using MTTR to improve maintenance efficiency
Where MTBF shows how frequently equipment fails, MTTR shows how quickly the organization restores it. You cannot prevent every failure, but you can often reduce the time an asset remains unavailable.
Improving work preparation, documentation, spare-parts availability, and fault diagnosis can reduce MTTR and improve availability, even when failures still occur.

Read more
Manage unplanned breakdowns with defect reporting
SERTICA Defect Reporting provides a simple, structured process for managing unplanned breakdowns. It helps ensure that every unplanned job is documented, tracked, and managed from discovery to resolution.
Availability in practice
Understanding Availability
Availability connects maintenance performance with operations because it shows how much of the required operating period an asset, system, or vessel is ready for use.

Read more
Structure workflows with Dry Dock
Bring your entire docking project into one structured workflow and manage all planning in one platform
How MTBF, MTTR, and availability work together
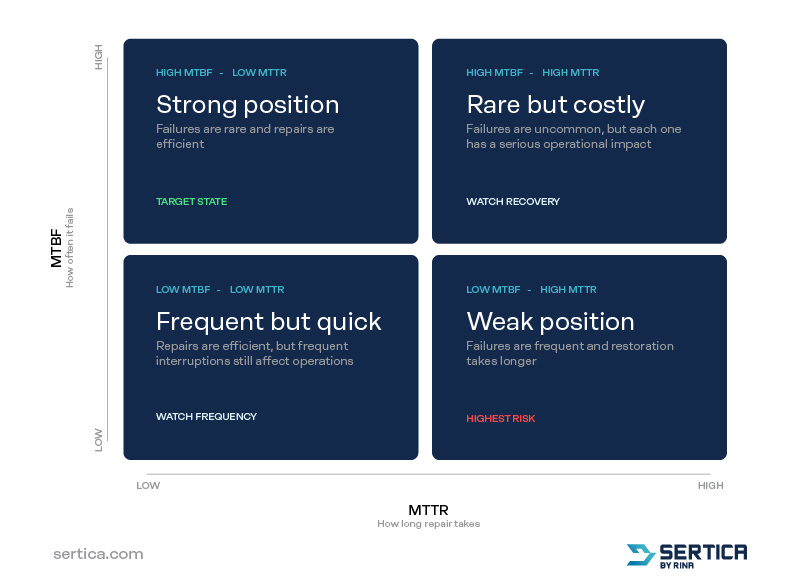
A high availability figure alone does not explain why performance improved or declined. Understanding the result means bringing together data on MTBF, MTTR, planned maintenance, logistical delays, and other downtime causes.
SERTICA does not just help you capture the data. Using the SERTICA Analytics and Dynamic Dashboard module, you can quickly get a visual overview of your KPIs or create the relevant reports you need, for example, reports for upper management or detailed reports for a technical deep dive.
Data quality
Challenges when measuring maintenance performance
When maintenance data is scattered, the full operational cost remains difficult to see. It appears as downtime, reactive work, manual reporting, repeated failures, and repairs delayed by unavailable spare parts.
SERTICA keeps all of that data in one place and is designed to guide users, so the relevant data is captured and logged in a structured, consistent way, which is exactly what reliable KPIs depend on.
Explore examples on how to visualize and monitor maintenance KPIs with dashboards:
Actions
Turning maintenance data into operational improvements
The purpose of MTBF, MTTR, and availability is not simply to produce another monthly report. The metrics should support decisions and continuous improvement.
Getting there depends on consistent data, and that is where a Planned Maintenance System makes a difference. SERTICA Maintenance brings maintenance jobs, component information, histories, documentation, defects, and spare-parts data into a structured environment. See it in action in this short introduction to SERTICA Maintenance:
When crews and shore-based teams record failures and downtime consistently, the system provides a stronger foundation for reliable KPIs and informed maintenance decisions.
Measured and acted on together, MTBF, MTTR, and availability turn maintenance from a monthly report into a way to raise uptime, control costs, and keep vessels operating safely and efficiently.
More about SERTICA Maintenance
Read more
Structure workflows with SERTICA Maintenance
Plan, structure, and execute maintenance jobs in one system to reduce downtime and extend equipment lifetime.