Answers based on the screen you’re working in
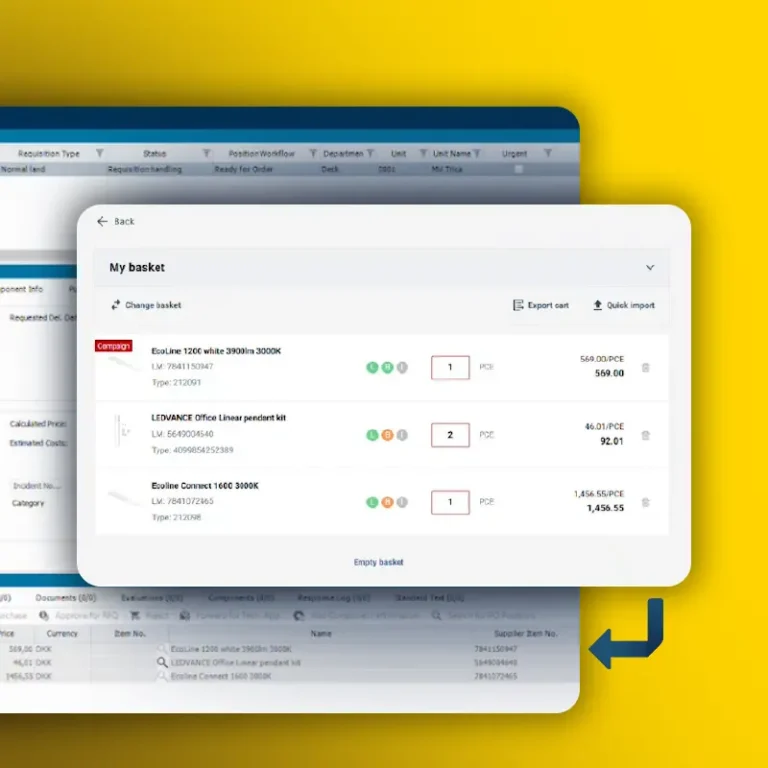
Sera works on most screens in SERTICA 6. When you ask a question, Sera answers based on the data on the screen you’re currently on.
For example, if you are on the purchase order screen, you can ask how many orders you have per supplier, and Sera gives you the answer.
Visualize your data
Sera can also show the result visually and automatically picks the chart type that fits your data best: a line chart for data over time, a column chart for comparing amounts or counts, or a scatter plot for showing relationships between values. If you prefer to see the result as a table, just ask Sera.
This gives you a quick, clear overview of larger datasets and makes it easier to spot patterns and compare figures.
With Sera, you can:
- Ask questions about the data on the screen you’re currently on
- Visualize results in the chart type that fits your data
- Get results as a table on request
- Get a quick overview of larger datasets
Sera is available now in SERTICA 6. If you are using SERTICA 5, Sera is available in the web extension modules.
Would you like to know how Sera can be added to your SERTICA setup? Contact us →