
This catalog presents a set of ship management dashboards used by SERTICA users and experts
See the dashboards as an inspiration to your future implementation of dashboards to ensure improved performance onboard your vessels.
Contents:
- HSQE
- Procurement
- Technical Management
- Crew
- IT
- Management
Data originates from the Analytics tool in SERTICA or from Excel spreadsheets and is presented directly in
SERTICA Dashboards or Power BI.
All dashboards use the same color codes which are set according to internal KPIs:
- Green: All okay
- Yellow: Monitor
- Orange: Critical
- Red: Alert
- Black: No limit or KPI is set
The brilliant thing about the dashboards is that you can access all data behind by clicking on the numbers.
To anonymize customer data and sources, some information has been blurred.
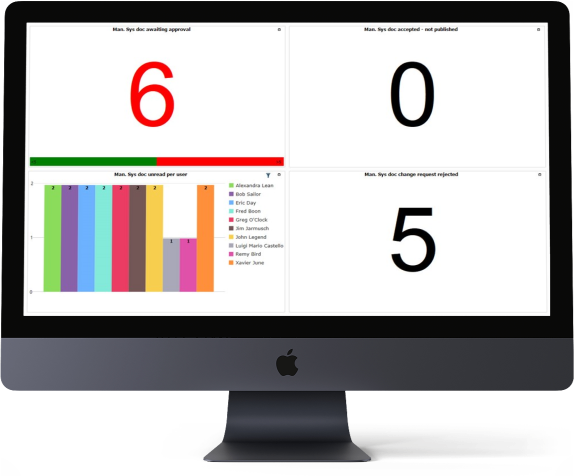
HSQE - Need an overview of your documents?
People in the HSQE department work with a lot of different documents daily. Make this easier to navigate by displaying important KPIs related to documentation in the Management System.
In this dashboard, you can see that an internal policy has decided that if more than 5 documents are awaiting approval, the number turns red. In this case, 6 documents are awaiting approval.
The dashboard also shows how many documents have been accepted, but not yet released – in this case 0 documents.
The number 5 illustrates how many change requests have been rejected by the office. Finally, the graph tells who has read the documentation.
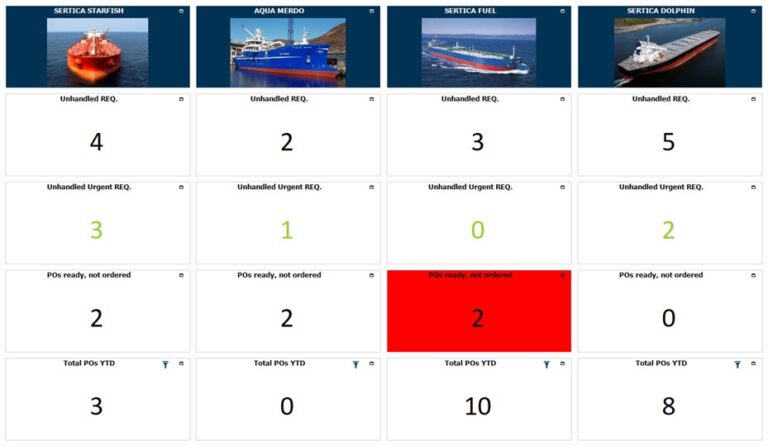
Procurement - Compare sister vessels to optimize procurement
If you are responsible for the procurement to several vessels, you can benchmark procurement numbers and actions.
In this dashboard, the focus is on REQ (unhandled and unhandled urgent) and POs (total and not ordered).